Graph Set Up in NagiosGrapher
The directory /etc/nagios/ngraph.d contains the graph files that will build your graphs. By default this directory contains subdirectories, templates and in side templates; standard and extra. The first thing you should do is review the template files in /etc/nagios/ngrpah.d/templates/standard. This assumes you have NagiosGrapher already set up. You will see many of the templates end in .”disabled” which you will then need to move them so they end in a .ncfg”, for example:
mv check_mysql.ncfg_disabled check_mysql.ncfg
Check that nagios owns the templates so they can be read.
chown -R nagios:nagios /etc/nagios/ngraph.d
Live Nagios Training is available as well as Linux consulting if you need additional help.
When you start setting up graphs you will find that whether you have used basic checks, nrpe, snmp, ssh or passive checks, you will find some incompatibilities with NagiosGrapher due to the regular expressions (perl) used in the program. The service_name creates a regular expression which is used by NagiosGrapher to determine the service. The implications are that you can use a text string to include all of the services that are related. For example, when you are testing disk usage you could use “disk” in the
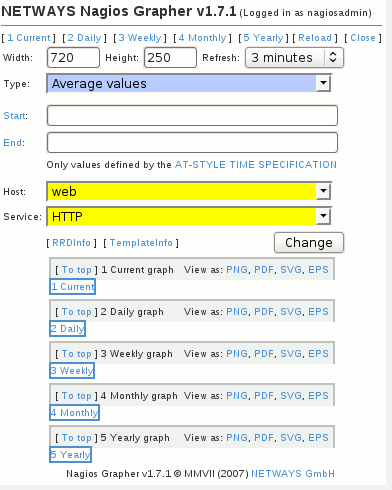
The graph output can be modified. Note the width, height and refresh rates are all able to be changed. The host can be selected and the service is also a selection.
“Average values” is the default but you can select minimum or maximum values as well.
There are 5 graphs available for each service:
Current
Daily
Weekly
Monthly
Yearly
These five graphs will allow you to view a history that can provide a useful comparison to current values.
One of the keys to getting these graphs to work correctly is to avoid service_names or graph_values that are the same in two templates. When you have these similar values you will see that the image for the graph will not appear and in fact, NagiosGrapher will not work correctly.
Graphing HTTP Response Time
There is a template for graphing the response time of your web server. In order to set this template up you must configure 3 things; set up the host, the service and the template. The three are related and must be able to communicate based on similar features. For example, there are two text strings which are important. The first text string is the check_command string “check_http”. The second is the service_description “HTTP”. You can see that these are part of each of the configuration files listed.
hosts.cfg
define host{
use generic-host
host_name web
alias Web Server
address 192.168.3.200
check_command check_http
}
services.cfg
One thing to note is the service_description which NagiosGrapher will pick up and use.
define service{
use generic-service
host_name web
service_description HTTP
check_command check_http
}
NagiosGrapher Template for check_http
define ngraph{
service_name HTTP
graph_perf_regex time=\s*([0-9\.,]+)
graph_value http_res
graph_units seconds
graph_legend HTTP response time
rrd_plottype AREA
rrd_color c0c0ff
}
define ngraph{
service_name HTTP
type CDEF
graph_value http_cdef
graph_units
graph_legend
graph_calc http_res
rrd_plottype LINE1
rrd_color 000000
}
# [EOF]


