NagiosGrapher is an interesting tool used to process data and represent it in a graph form. The great thing about this program is that you can just about graph anything with it. NagiosGrapher saves data with RRDtool which will then generate the graph. The serviceextinfo will also generate information. This tutorial is the first in a series that shows you how to install it, next will show you how to set up specific graphs that you want to use.
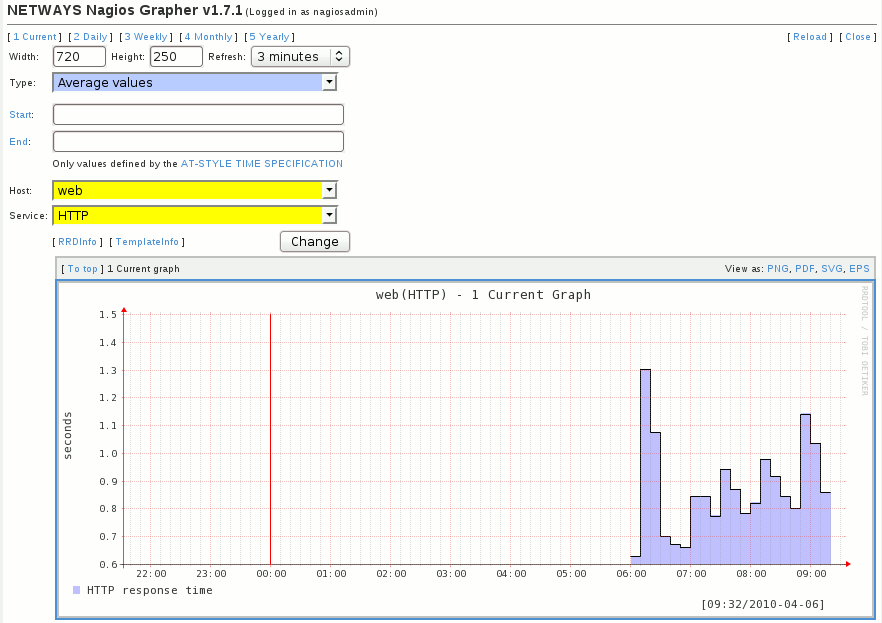
NagiosGrapher willl allow you to graph most of the data that you are interested in evaluating. Here you can see the response time required to access a web server. No doubt you can view the actual statistics but it is not like seeing it in graph form.
Preparation
There is considerable preparation you must do to be able to run Nagiosgrapher. In the end the work is worth.
The first tool you need to install is RRDtool. This tool allows the creation of graphs and functions as a unique database that overwrites old data as it reaches the starting point of a circular progression of data, thus is is called “Round Robin”. RRDtool calculates the rate of change from the value that it had previously. It uses timestamps on all of the information in order to due the necessary calculations.
You can either download the source code from http://oss.oetiker.ch/rrdtool/ or if you are using CentOS with the rpmforge repositories you can use yum to install it.
yum install rrdtool
Download Nagiosgrapher from sourceforge.net http://sourceforge.net/projects/nagiosgrapher/
Download NagiosGrapher-1.7.1.tar.gz and save it in /opt.
tar xzvf NagiosGrapher-1.7.1.tar.gz
cd NagiosGrapher-1.7.1
The configure is built by autoconf so you will need to install that application before you can build Nagiosgrapher..
yum install autoconf
However, when you run configure it will access a file that will determine the layout of your distro. Here is a portion of the file called config.layout. This is one of the most important steps you will make, and if not done correctly will certainly case your system to fail. The paths that you see here are necessary for the program to find the resources that it needs. CHECK YOUR PATHS and verify that you have a setup that works for your distribution.
<Layout redhat>
prefix: /usr/lib/nagios
nagios_config: /etc/nagios/nagios.cfg
nagios_config_cgi: /etc/nagios/cgi.cfg
nagios_images: /usr/share/nagios/images
nagios_images_logos: /usr/share/nagios/images/logos
nagios_folder_cgi: /usr/lib/nagios/cgi
nagios_contribution: /usr/lib/nagios/plugins/contrib
perl_inc: ${nagios_contribution}/perl
ng_config: /etc/nagios
ng_config_sub: ${ng_config}/ngraph.d
ng_daemon: /var/log/nagios/rw
ng_srvext_file: /etc/nagios/serviceextinfo.cfg
ng_srvext_dir: /etc/nagios/serviceext
ng_interface_pipe: /var/log/nagios/rw/ngraph.pipe
ng_perffile_path: /var/log/nagios/
ng_logfile: /var/log/nagios/ngraph.log
ng_rrd: /var/lib/nagios/rrd
ng_rrd_font: /usr/local/rrdtool/share/rrdtool/fonts/DejaVuSansMono-Roman.ttf
ng_tmp_path: /tmp/nagiosgrapher
ng_cgi: /nagios/cgi-bin
ng_logos: /nagios/images/logos
ng_pid_file: ${ng_daemon}/nagios_grapher.pid
init_script_dir: /etc/init.d
logrotate_conf_dir: /etc/logrotate.d
</Layout>
One this is edited you can see that the configure is performed with the template of your choosing.Once this is created you can run (use your template);
./configure –with-distro=redhat –with-layout=redhat
When it is complete run the make testdeps to check for dependencies.
make testdeps
/usr/bin/perl ./tools/testdeps.pl
Checking Data::Dumper … found
Checking File::Copy … found
Checking File::Basename … found
Checking Carp … found
Checking POSIX … found
Checking Time::HiRes … found
Checking Time::Local … found
Checking Storable … found
Checking GD … not installed!
Checking Image::Magick … not installed!
Checking RRDs … found
Checking CGI … found
Checking CGI::Carp … found
Checking IO::Handle … found
Checking URI::Escape … found
Checking Calendar::Simple … not installed!
make: *** [testdeps] Error 1
Install those packages not installed. No shortcuts here, on a CentOS distribution you will have specific problems with ImageMagick. So be careful to follow all of the steps.
yum update
yum install perl-GD
yum install ImageMagick
yum install ImageMagick-devel
yum install ImageMagick-perl
Use the perl shell to install some programs.
perl -MCPAN -e shell
cpan>install Calendar::Simple
If you are using rpmforge for the repositories for ImageMagic, you may have to update and then use this command to clean out the cache.
yum clean all
Then try to install your packages.
make install
Prepare NagiosGrapher
In order to allow nagios to write service perfdata you will need to edit nagios.cfg and the commands.cfg.
Edit the /etc/nagios/nagios.cfg:
cfg_dir=/etc/nagios/ngraph.d
cfg_dir=/etc/nagios/serviceext
process_performance_data=1
service_perfdata_file=/var/log/nagios/service-perfdata
service_perfdata_file_template=$HOSTNAME$\t$SERVICEDESC$\t$SERVICEOUTPUT$\t$SERVICEPERFDATA$\t$TIMET$
service_perfdata_file_mode=a
service_perfdata_file_processing_interval=30
service_perfdata_file_processing_command=process-service-perfdata-file
Edit /etc/nagios/objects/commands.cfg:
define command{
command_name process-service-perfdata-file
command_line mv /var/log/nagios/service-perfdata /var/log/nagios/service-perfdata.$TIMET$
}
Check the log level
Default loglevel is set to 511 which means all, which is good for initial setup but could cause the logfile to grow quickly.
Edit /etc/init.d/nagios_grapher
You may need to edit the script to point it to the correct location for the collect2.pl script. You also may have to create the nagios_grapher directory and make collect2.pl executable. On a CentOS system the following change had to be made to get it to work.
DAEMON=/usr/lib/nagios/plugins/contrib/nagios_grapher/collect2.pl
You may have to create the temporary directory for nagiosgrapher.
mkdir /tmp/nagiosgrapher
chown -R nagios:nagios /tmp/nagiosgrapher/
When you have restarted the nagios_grapher and nagios you should see the icon that represents Nagiosgrapher as you can see below. When you click on the icon
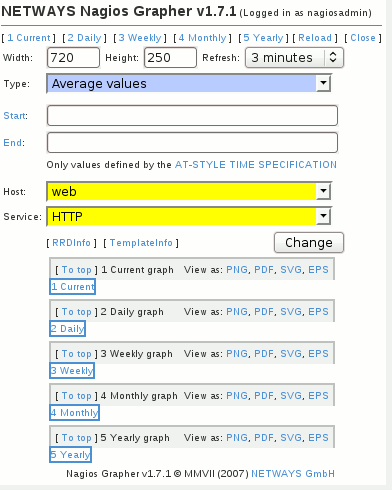
When you click the icon the browser opens which provides you several adjustments for your graphs.


{ 3 comments }
./configure –distro=redhat –layout=redhat <- worked right out of the tarball for me!
Watch out for 64-bit architectures….
I had to move /usr/lib/nagios/* to /ur/lib64/nagios.
Then I symlinked /usr/lib64/nagios to /usr/lib/nagios for good measure.
Thank you for the great writeup.
I’m unable to find my nagios_contribution folder. I have the nagios-plugins version 1.4.14 installed. My path to anything nagios related is under /usr/local/nagios/… Where could it be found?
This is what my config.layout file looks like for my Fedora 12 x64 server:
prefix: /usr/local/nagios
nagios_config: /usr/local/nagios/etc/nagios.cfg
nagios_config_cgi: /usr/local/nagios/etc/cgi.cfg
nagios_images: /usr/local/nagios/share/images
nagios_images_logos: /usr/local/nagios/share/images/logos
nagios_folder_cgi: /usr/local/nagios/sbin/
nagios_contribution: /usr/local/nagios/libexec
perl_inc: ${nagios_contribution}/perl
ng_config: /usr/local/nagios/etc/
ng_config_sub: ${ng_config}/ngraph.d
ng_daemon: /usr/local/nagios/var/rw
ng_srvext_file: /usr/local/nagios/etc/serviceextinfo.cfg
ng_srvext_dir: /usr/local/nagios/etc/serviceext
ng_interface_pipe: /usr/local/nagios/var/rw/ngraph.pipe
ng_perffile_path: /usr/local/nagios/var/
ng_logfile: /var/nagios/ngraph.log
ng_rrd: /usr/local/nagiosgraph/rrd
ng_rrd_font: /usr/share/rrdtool/fonts/DejaVuSansMono-Roman.ttf
ng_tmp_path: /tmp/nagiosgrapher
ng_cgi: /usr/local/nagios/sbin/
ng_logos: /usr/local/nagios/share/images/logos
ng_pid_file: ${ng_daemon}/nagios_grapher.pid
init_script_dir: /etc/init.d
logrotate_conf_dir: /etc/logrotate.d
{ 1 trackback }